Service Details
Magnetic Resonance Imaging
Facilities and Equipment
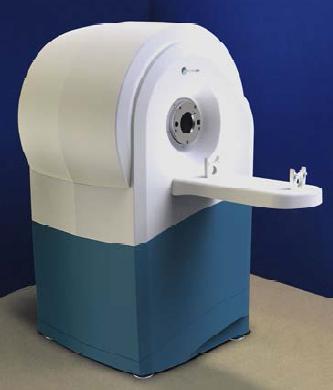
The MRSolutions 4000MRS Preclinical MRI is located in the IVISR at the Moores Cancer Center. Capable of fild strengths of up to 4.7T the system is ideal for high definition images of soft tissues.The tight shielding of the magnet allows for a very small fringe field, increasing safety while improving image quality and machine flexibility. With integrated anesthesia and animal monitoring systems, this magnet is ideal for rapid soft tissue imaging, contrast enhanced dynamic scans, longer scans of in vitro or post mortem samples and everything in between.
Service
MRI is the optimum imaging modality for soft tissues, and compliments the capabilities of PET to image harder structures and radiolabeled tracers respectively. It is ideal for finding and measuring soft tumors or other organs, and when combined with contrast, can also image the uptake of some experimental agents. With a wide assortment of different scan types, both T1 and T2 weighted, images can be collected to reveal both anatomy and physiology. Repeated longitudinal scans can explore the development of disease states and lesions, as well as potentially indicate response to treatment.
-
High resolution images of soft tissues, with arbitrary slice orientation
-
Measurement of tumor burden with and without contrast
-
Contrast development
-
Dynamic scans indicating agent uptake and distribution
-
Real time animal monitoring
-
Anatomic Imaging
MR imaging will be performed in high resolution to provide anatomic landmarks to co-localize signals acquired with the gamma camera.
Other Services
-
Development of MR based contrast media
We currently use Multihance, a T1 contrast agent, as our main contrast agent. It is a widely available and used in clinics worldwide. If your needs require alternate contrast methods, we can help in the research and acquisition of the appropriate agents.
Photoacoustic Imaging
VevoLAZR (Fujifilm/VisualSonics)
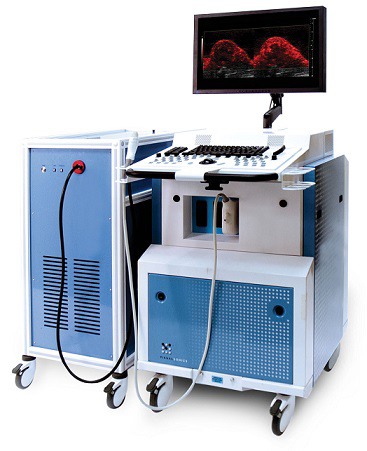
The VevoLAZR is an in vivo preclinical photoacoustic imager developed by VisualSoncics/Fujifilm. It is based on the photoacoustic effect where short pulses of light are optically absorbed inducing an ultrasound signal. Hence, photoacoustic images are ultrasound images of optical absorption with the advantage of superior ultrasound depth penetration and spatial resolution over solely optical absorption imaging. Furthermore, the VevoLAZR employs a tunable laser enabling photoacoustic imaging spectroscopy. Intrinsic optical absorbers in tissue, namely oxy- and deoxy-hemoglobin, can provide images of total hemoglobin concentration and hypoxia. Optically-absorbing contrast agents are used for photoacoustic molecular imaging. The VevoLAZR is seamlessly integrated with a Vevo2100 high-frequency, in vivo preclinical ultrasound imager allowing real-time co-registered photoacoustic and ultrasound images.
Vevo2100 (Fujifilm/VisualSonics)
The Vevo2100 is an in vivo preclinical ultrasound imager developed by VisualSoncics/Fujifilm. It employs high frequency ultrasound for high-resolution, real-time ultrasound imaging. Standard ultrasound imaging (B-mode, M-mode, PW, Color Doppler, Power Doppler, Non-linear contrast agent imaging, 3D mode) is available. An advanced physiological monitoring unit tracks temperature, ECG, heart rate, blood pressure and the comprehensive software analysis tools include VevoStrain (myocardial), VevoCQ (perfusion, contrast), and VevoVasc (cardiovascular function) plus several others.
The VevoLAZR/Vevo2100 system was funded by a NIH S10 grant, PI Dr. Hall. Dr. Hall is available for consulting as needed.
Positron Emission Tomography
The IRIS microPET HR provided by Inviscan/Scintica is a cutting-edge preclinical PET scanner, optimized for in-vivo imaging of rodents. Its key features include exceptional spatial resolution, low noise, and high sensitivity, making it particularly well-suited for brain studies in mice and rats, in addition to all PET applications. The scanner's design allows for imaging of rats, mice, and multi-mice (up to 3 simultaneously) within its trans-axial field-of-view (> 80 mm). The scanner comprises of an octagonal arrangement of 8 detector blocks, utilizing LYSO scintillation crystals coupled with Hamamatsu PSPMTs, totaling 11232 detector elements. This configuration achieves a central spatial resolution of 0.7 mm FWHM (OSEM 3D) and a sensitivity > 3% within the recommended energy window of 250-650 keV. The system supports both single and multiple bed positions, providing an axial FOV of 43 mm and over 400 mm, respectively for whole body imaging. The scanner has a physiological monitoring system that can take the temperature, respiration rate, and an ECG of the rodent while it is on the bed. The bed is heated to keep the rodents at an appropriate temperature. A workstation is available in B211 with Imalytics Preclinical software for image analysis and other analytical tools

Gamma Camera Imaging
Dynamic planar imaging (list mode) will be performed with the Biospace Gamma--Imager, which is available in the IVISR. This unit is capable of high resolution planar imaging utilizing its position sensitive photomultiplier tube. If the agent is radiolabeled with Tc-99m a low-energy high sensitivity collimator can be used; the energy window will be set at 127 – 171keV. If the agent is radiolabeled with In-111, a medium-energy high sensitivity collimator can be employed and a dual energy windows set at 145 – 195keV and 208 – 282keV. After an iv injection (0.5 mCi) of a known amount (mole) of agent list-mode data can be acquired for two hours, after which a plasma sample will be used to calibrate heart time-activity data to mole of radiopharmaceutical per liter of plasma. After euthanasia the tumors and other tissues can be excised and assayed for radioactivity. Using Biospace software the list-mode data can be reformatted into frames of any duration. The list mode acquisition will allow reanalysis of the data at a finer temporal resolution as deemed necessary based on the dynamics of the blood and tissue radiopharamcokinetics. After comparison to an injection standard the tumor and heart/lung time-activity data can be calibrated to absolute amount (mole) of radiopharmaceutical within the entire organ or tissue. The calibrated time-activity curves can be transferred for kinetic analysis.
Ultrasound
Facilities and Equipment
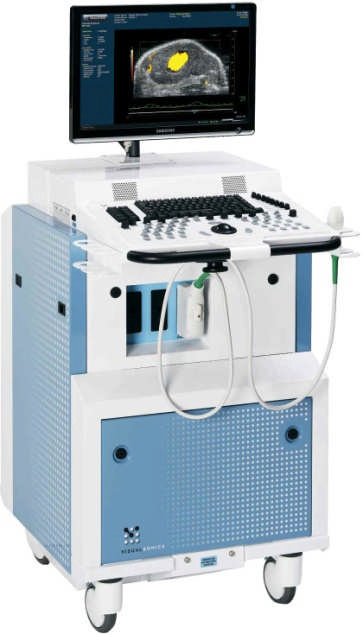
Like its predecessor, the Vevo 2100 provides the small animal researcher with the ability to visualize and quantify small animal anatomical targets, hemodynamics and therapeutic interventions with resolution down to 30 microns. Because it is non-invasive, longitudinal monitoring and quantification of phenotypes and therapeutic regimes can be monitored in the same animal over time. New functionality now available on the Vevo 2100 includes increased temporal resolution, improved workflow and ergonomics, and newly available features — including the release of Power Doppler to visualize and quantify relative microvasculature in vivo for anti-angiogenic studies.
Service
Non-destructive, rapid, high spatial and contrast resolution imaging of live mice that could potentially be done in a sterile environment and without anesthesia, provides a powerful tool to monitor superficial and deep tumors. It is well known that subcutaneous tumors exhibit different vascular morphology without the influence of their native host tissue [1]. Ultrasound provides the ability to detect and monitor deep tumors analogous to physical examination of superficial tumors with minimal risk to the animal. Specific services include:
-
Monitoring of in situ tumor growth
-
Left ventricular volume measurement
-
Imaging in a sterile environment
-
Tumor viability and quantification of relative blood flow and blood volume with contrast media.
Structural In-Vivo Imaging of Live Mice

Ultrasound is a practical imaging tool that can image mice in real-time at high frame rates. It is ideally suited at imaging naturally occurring tumors and monitoring their growth (Figure 7) and because of the small size of mice can easily distinguish small intraperitoneal tumors from bowel (Figure 8). Because of the high resolution available at high frequency, it can image the liver of a mouse to detect metastases (Figure 9). Further, the availability of ultrasound contrast media allows the visualization of tumor vessels (Figure 8 & 9). While it is difficult to perform CT and MRI in a sterile environment, ultrasound imaging can be performed in a sterile fashion as is currently done with intra-operative ultrasound. The unit is draped with a sterile, transparent cover allowing access to the unit’s controls and the transducer is placed in a sterile sleeve preventing contamination of the scanning field.
The ultrasound images shown in Figures 7-9 were acquired while the animals were anesthetized. To minimize animal loss due to anesthesia, we will image mice in a sterile fashion but without anesthesia, when no intravenous administration is required. Since nude mice do not require shaving and since ultrasound acquires images in real-time, contact with skin and motion will not hinder the ability to survey the animal’s abdomen. This can be accomplished by having an assistant immobilize the animal by holding it with the dorsal skin, as is done during intraperitoneal injections, by one hand and holding the hind legs to slightly stretch the abdomen by the other. The sonographer can then quickly scan the abdomen to survey for the presence and size of tumors. A non-nude mouse can be anesthetized with Isofluorane, a quick acting anesthetic, to allow for shaving, and then it can be imaged while non-anesthetized. While it can be argued that stress could affect the animals’ physiology, anesthesia has more depressing effects on mice. Nonetheless, imaging without anesthesia is not intended to image physiology that requires contrast administration, rather, it is intended to detect and monitor the anatomy of tumors analogous to a physical exam.

Images acquired using the Matrigel angiogenesis model described were exquisite (Figure 10). They allowed the visualization of the angiogenic vascular plug before ultrasound contrast was administered because of the heterogeneous architecture where vessels developed in the bFGF-impregnated homogeneous Matrigel. When contrast was administered, dramatic enhancement of the perfused vessels occurred (arrows in Figure 10).
Sterile Imaging will be performed by first wiping down the unit with disinfecting solution and wheeling it into the treatment room. Sterile Gel will be placed between the transducer surface and the sterile sleeve covering it and its cable. The unit will be covered with a sterile plastic transparent drape to allow access to its controls. The sonographer will gown and glove according to protocol. For standard monitoring of tumor size, nude mice will be scanned without anesthesia as described above using a small amount of sterile warm gel for contact. When a tumor is detected, images will be acquired with internal landmarks to allow session to session or post mortem confirmation, and tumor dimensions will be measured and images stored digitally.
Functional In-Vivo Imaging of Live Nude Mice
Relative blood flow and fractional blood volume indices can be assessed with ultrasound contrast intermittent imaging [2-5]. Further, we also showed that fractional blood volume, determined by intermittent imaging following long interscan delay using a Vx2 tumor model, correlates with microvascular density, an index of angiogenesis. Therefore, it is possible to determine tumor vascularity and angiogenesis and possibly the effect of anti-angiogenic therapy. Since imaging sessions can be performed repeatedly, particularly if done with quick anesthesia to place an IV line, tumor response to interventions such as an anti-angiogenesis therapy can be monitored as frequently and for as long as desired for longitudinal experiments. Assessing relative blood flow using the destruction model [6] rather than the destruction reperfusion model requires only 2 or 3 seconds without animal motion as compared to 15 sec.
- Roberts WG (1998), Delaat J, Nagane M, Huang S, Cavenee WK, Palade GE. Host microvasculature influence on tumor vascular morphology and endothelial geen expression. Amer J Path 153;1239-1248.
- Wei K (1998), Jayaweera AR, Firoozan S, et al. Quantification of myocardial blood flow with ultrasound-induced destruction of microbubbles administered as a constant venous infusion. Circulation 97:473-83.
- Villanueva FS (2002), Abraham JA, Schreiner GF, et al. Myocardial contrast echocardiography can be used to assess the microvascular response to vascular endothelial growth factor-121. Circulation 105:759-65.
- Kono Y (2000), Mattrey RF,Summers H, Baker K, Steinbach G. Visualization of Tumor Vessels with Ultrasound Contrast and the Potential for Quantitative Analysis of Relative Tumor Blood Flow and Fractional Blood Volume. AIUM 44th Annual Convention, San Francisco, J Ultrasound Med 19: S59.
- Mattrey RF (1998), Peterson TM, Baker KG, Dieranieh LH, Lee YZ, Steinbach GC: The Use of Ultrasound Contrast to Quantify Kidney Perfusion with B-mode Imaging. RSNA, Chicago, Radiology 209:461.
- Lucidarme O (2003), Kono Y, Corbeil J, Choi SH, Mattrey RF. Validation of ultrasound contrast destruction imaging for flow quantification. Ultrasound Med Biol 29:1697-704.
Image Processing / Kinetic Modeling
Facilities and Equipment
The In Vivo Imaging Shared Resource uses a variety of severs and workstations for processing images acquired from the preclinical imagers. All of the imagers are linked to a Windows-based server. Two Unix- and Linux-based servers with CD-RW and DVD-R capability (SUN FireV100 or Pentium4 Linux) running Luminex ® Disc Recording Software, are available for image processing, a web based archival database Fire Series ® will be implemented to facilitate the large volume of image data that will be generated in the ICMIC to allow investigators the ability to store or retrieve their data remotely. We have two Sun workstations one with a 400 MHz UltraSPARCIIi 360MHz processor with 512 MB RAM and 100 GB IDE HD and 36GB Ultra320 SCSI HD and 24 bit graphics system and the other Sun Blade 150 with a 650 MHz UltraSPARC IIi 512MB RAM available for image fusion. Both systems operate IDL ® 6.0 (Research Systems, Inc, Boulder Co) for image processing, kinetic modeling, parametric image formation and data visualization. These systems are networked to allow imaging devices.
Service
While much of the service can be provided in house, high-level computing will be expanded in the future through collaboration with the SDSC. The ability to acquire, transmit, process, archive, and manipulate image datasets for modeling, fusion, visualization, and interpretation, and the use of acquired or parametric images to guide intervention are important immediate and long term objectives. Specific services include:
-
Image data storage and retrieval
-
Dynamic image analysis and segmentation
-
Kinetic analysis of image data and generation of parametric images
-
Multimodality image fusion.
Image Archival and Retrieval
Image archival is provided by an XeoByte 5-position magnetic tape carrousel which is attached to the Windows-based server that is intraneted to the imagers. A Unix-based server with CD-RW and DVD-R capability. Initially a low-end server such as SUN FireV100 or Pentium4 Linux running Luminex ® Disc Recording Software is used for intermediate data storage. As demand increases a midrange server will be considered. A web based archival database Fire Series ® will be implemented to facilitate the large volume of image data that will be generated in the ICMIC. The web-based feature will allow individual investigators the ability to store or retrieve their data remotely. The image data from the various projects include, 2D histology, 2D digital autoradiography, 2D Ultrasound, 2D optical, 3D X-ray CT, 3D MRI, 3D PET. Images acquired in a dynamic mode will have an additional time dimension.
Initially, a low end Unix or Linux server will be used to drive a Luminex ® Disc-Recording system for data archival on CDROM or DVD. As the volume of data increase, the Unix or Linux server will be upgraded to a midrange server and used to provide user accounts, serve as a host for the database and database searches, and serve as a web access point for entry into the database. The web based user interface will be implemented from a commercial product (Fire Series ®, Luminex, Inc) or developed in-house to simplify investigator access and retrieval of their image data from the image archive database. Eventually this service will be provided through the SDSC where disk storage is essentially limitless and data security, anonymity and preservation are well developed, particularly when handling patient data.
Multimodality Image Fusion
The multimodality image fusion will use the approach of Mutual Information. This technique is fully automatic and will allow 2D as well as 3D image fusion and does not require fiduciary markers or sources. This technique is also capable of registering non-rigid objects, so that the methods of elastic mapping can also be applied. This includes 2D as well as 3D digital image data from the various devices. The resource has modified existing software for image registration so that the new technique of Mutual Information can be applied as the similarity measure. Two-dimensional histological images can be registered to the 2D digital autoradiographic data from a phosphor imager. The tomographic optical images will allow image fusion to other functional (PET, MRI) and anatomical images (CT).

The general algorithm commonly used for image registration is similar to the one we have implemented as shown in Figure 14. As in most algorithms, the similarity measure is what is iteratively optimized (maximized or minimized depending on the type of similarity measure used).
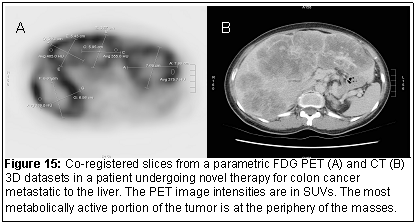
To apply the registration technique to images from different modalities (for example MRI and PET or CT and PET (Figure 15), we have kept the parameters needed for registration to a total of 6. The voxel size along the x, y, and z directions, (sx, sy, sz) should be known based on the DICOM image data headers. Computationally, this optimization can be handled by the Nelder-Mead simplex method and a fast workstation. Since the prior submission, additions to the existing code and the implementation of the Mutual Information criteria as the similarity measure has been implemented for multimodality image registration.
Data analysis software
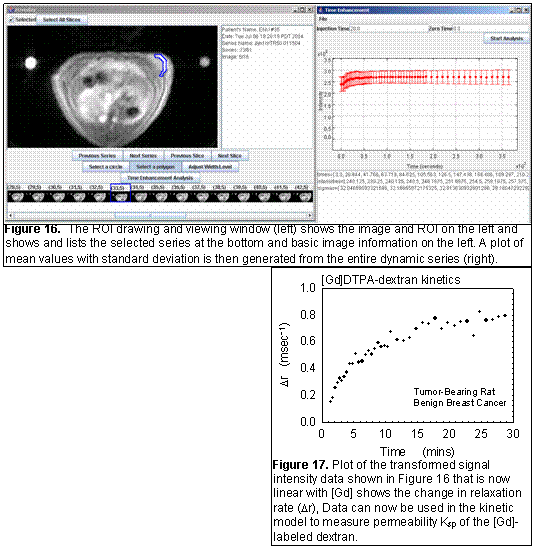
fOverlay is an in-house developed software tool for collecting region-of-interest (ROI) data from DICOM images (Figure 16). Current features include: fast DICOM reading, polygonal and circular ROIs, simple plotting of ROI averages, and exporting of time and average data for analysis with other software. Current development is focused on more general purpose data collection, saving ROIs for later review, export of data to relational databases, and more sophisticated ROI drawing, such as multiple slices to capture volumes-of-interest. The final implementation will automatically generate the transformed parameter of interest. For example in the MR example (Figures 16 and 17), the signal was transformed into a relaxation rate and plotted over time.
Dynamic or Kinetic Modeling of various molecular imaging agents
When employing kinetic modeling on a pixel-by-pixel basis, it is important that the 3D datasets acquired dynamically are properly co-registered since motion between acquisitions is inevitable. This requires not only translation and rotation but also morphing. We have in-house CADStream software (Confirma Inc., Kirkland, WA) operating on a Pentium IV XP that registers each dataset to a reference data set such that each tissue voxel is superimposed on the identical tissue voxel for the entire 3D dataset series. In-house software written in IDL ® for Dynamical Modeling uses an UltraSPARC and a Pentium workstation.
The image data acquired in a dynamic mode adds the dimension of time in the data analysis. The techniques of dynamic modeling using the state-space equations written in IDL will allow a comprehensive and flexible approach to modeling the various dynamic images [1] SSM (State Space Modeler, UCLA, Los Angeles, CA). A system of any size or complexity can be modeled as long as it can be defined by a set of differential equations. The estimation of the model parameters involves the calculation of the matrix exponential using the Pade’ approximation in an iterative algorithm [2]. The FDG 3-compartment model, N-13 2-compartment model, and O-15 flow model have already been implemented in SSM and are being used for a variety of projects at UCLA where they were originally developed and are currently being further developed at UCSD by Dr. Hoh.
There are several potential approaches to obtain the input function with new radiotracers. If the tracer has no significant myocardial uptake and minimal metabolism, then a simple left ventricular region of interest may be used with the appropriate correction for recovery coefficients and correction for plasma/blood equilibrium. The recovery coefficient for the left ventricular cavity will be obtained by accurate measurements of the left ventricle with ultrasound (see Ultrasound section). If there is significant myocardial uptake with the new tracer, then other organs with significant blood pool will be utilized. Since the 15 cm axial field-of-view of the scanner will image the entire mouse, all organ tissues (liver, spleen, kidneys, brain, aorta) are available for estimating the input function. Modifications to the method of Green et al [3], of using different target organs with blood pool and or tissue uptake are alternatives to obtaining the plasma input function.
The model in Figure 18 is for an optically labeled receptor-binding probe. The Y1 input function data will be acquired by a fluorescent detector attached to the mouse’s tail. The Y2 observer will consist of time-domain data acquired from the optical imaging detector over the ROI and observational equations, represented by f p and f c, and will be modeled based on photon transport theory.
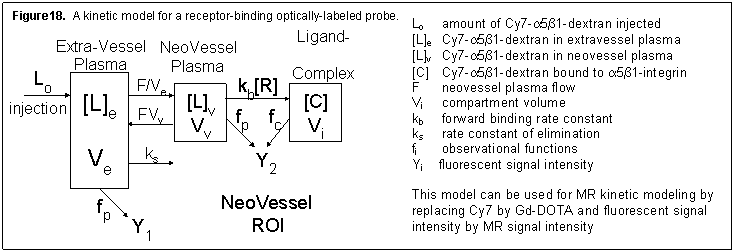
Using the 7T imager, we will acquire three pre-injection and serial post-injection volumetric images for 60 minutes. Time-enhancement curves will be analyzed using a three compartment kinetic model for the parameter estimation of tumor plasma flow F and kps [4, 5]. The latter parameter is an index of microvascular permeability and is a function of the agent’s diffusion coefficient [6]. Similar to the optical model (Figure 18), the MR model uses three compartments: extra-tumor plasma, tumor plasma, and tumor interstitium. We will independently estimate tumor plasma flow F and k ps. The precision will depend on the relative magnitudes of F/V e and k ps [7, 8]. Consequently, the precision of the F/V e and k ps estimates will depend on the diffusion coefficients of each Gd-DOTA dextran, and hence, the molecular size of each agent. Additionally, we will include observational equations, represented by f p and f c, which are functions of proton density N(H), tissue T1 and T2*, TE and TR, the relaxation rate constants k r, as well as the gadolinium concentration. Both f p and f c relate [L] e, [L] p, and [L] t to MR signal intensities Y 1, or Y 2 via an equation defined by the acquisition pulse sequence [9]. Note that Y 1 is the input function observed by MR sampling of the left ventricle (LV).
Generation of parametric images
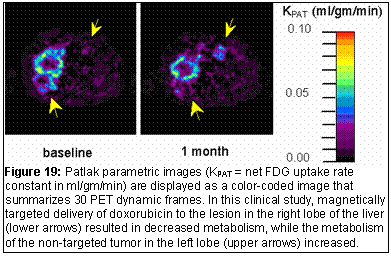
In-house software for generation of parametric images written in IDL ® will help the investigators of the ICMIC interpret the large volume of image data in a compact and summarized form [10 -13]. For example with the PET radiopharmaceuticals, images can be generated where each image pixel represents a compartment model rate constant or overall net-uptake-rate constant (Figure 19).
- Hoh CK (1996), Dahlbom M, Gambhir SS, Yang J, Phelps ME. State space modeler (SSM): a general software package for dynamic systems modeling. J Nucl Med 37: 303P.
- Cleve, M. and V.L. Charles, Nineteen dubious ways to compute the exponential matrix. SIAM Rev , 1978. 20: p. 801-836.
- Green LA (1998), Gambhir SS, Srinivasan A, Banerjee PK, Hoh CK, Cherry SR, Sharfstein S, Barrio JR, Herschman HR, Phelps ME. Noninvasive methods for quantitating blood time-activity curves from mouse PET images obtained with fluorine-18-fluorodeoxyglucose. J Nucl Med 39:729-734.
- Brasch R (1994), Shames D, Cohen F, Kuwatsuru R, Neuder M, Mann J, Vexler V, Muhler A, Rosenau W. Quantification of capillary permeability to macromolecular magnetic resonance imaging contrast media in experimental mammary adenocarcinomas. Invest Radiol Suppl(2):S8-S11.
- Shames DM (1993), Kuwatsuru R, Vexler V, Muhler A, Brasch RC. Measurement of capillary permeability to macromolecules by dynamic magnetic resonance imaging: a quantitative noninvasive technique. Magn Reson Med 29: 616-622.
- Jain RK (1988). Determinants of tumor blood flow: a review. Cancer Res 48: 2641-2658.
- Vera DR (1985), Krohn KA, Schiebe PO, Stadalnik RC: Identifiability analysis of an in vivo receptor-binding radiopharmacokinetic system. IEEE Trans Biomed Eng BME-13:311-322.
- Vera DR (1992), Scheibe PO, Krohn KA, Trudeau WL, Stadalnik RC: Goodness-of-fit and local identifiability of an in vivo receptor-binding radiopharmacokinetic system. IEEE Trans Biomed Eng BME-39:356-367.
- Vera DR (1995), Buonocore MH. A kinetic model for measurement of receptor concentration via magnetic resonance imaging of a paramagnetic contrast agent. Ann Biomed Engr 23:S64.
- Patlak C (1983), Blasberg R, Fenstermacher J. Graphical evaluation of blood to brain transfer constants from multiple-time uptake data . J Cereb Blood Flow Metab 3:1-7.
- Patlak C (1985), Balsberg R. Graphical evaluation of blood to brain transfer constants from multiple time uptake data. Generalizations . J Cereb Blood Flow Metab 5:584-590.
- Choi Y (1991), et al. Parametric images of myocardial glucose utilization rate generated from dynamic cardiac PET-FDG studies . J Nucl Med 32: 733-738.
- Hoh CK (2002), Hawkins RA, Ramaswamy M, Venook A, Koda J. Quantitative FDG PET measuring preliminary biologic activity with a magnetically targeted therapy. J Nucl Med 43:304P.
Protocol Development
Training and Consultation
Consulting Services
David R. Vera, PhD Radiopharmaceuticals and tracers
Carl Hoh, MD PET and gamma camera imaging
David Hall, PhD, DABR Fluorescent and photoacoustic imaging
Jiang Du, PhD MR imaging and contrast
Radiochemistry
Facilities and equipment
We currently have a radiochemistry laboratory at the UCSD Center of Molecular Imaging that is used for translational research and a radiochemistry laboratory adjacent to the SAIR that will be used to produce F-18 compounds for the rodent PET imager.
The UCSD Center for Molecular Imaging that is located approximately 2.5 miles from the SAIR in the CC, houses a Siemens EXACT HR+ and a CTI RDS-111 cyclotron that is capable of generating F-18, N-13, and O-151. The facility has a 1,500 s.f. radiochemistry laboratory equipped with two hot cells, two mini hot cells, six automated radiochemical synthesis modules, two chemical fume hoods, one lead-lined fume hood, a MCA, a gas chromatograph, HPLC with multi-wavelength and radioactive flow-through detectors, an auto-well gamma counter, a radioactive stripscanner, a UV/visible spectrometer, two dose calibrators, a rotary evaporator with a high vacuum system, a high purity water system, and a laminar-flow sterile bench. An UltraSPARC computer system at the PET facility is networked with UCSD so that images and data can be transferred to other special processing or data analysis computers located at UCSD. Software tools have been developed in IDL6.0 to allow sophisticated region of interest analysis in DICOM, ECAT7x, and INTERFILE image formats in static and dynamic image acquisitions. Tools for tracer kinetic modeling using state-space equations have also been developed in IDL. The software has been developed to be platform independent and currently runs on both SUN and PC workstations.
Service
The radiochemistry service is responsible for preparing a number of radiolabeled precursors for use by the ICMIC investigators. All 99mTc chelates will be based on the recent development of the bi-functional single amino acid chelate (SAAC) for technetium tricarbonyl. The F-18 precursor molecule will be based on an active ester of fluorobenzoic acid for labeling peptides and proteins. Bifunctional copper chelates will be based on the active ester of cross-bridged macrocycle, 4,11-bis(carboxymethyl)-1,4,8,11-tetraazabicyclo[6.6.2]hexadecane and are an alternative to F-18 when a longer physical half-life is needed. Note that all necessary analytical equipment to validate the radiotracers according to the American Chemical Society is available.
The radiochemistry group led by Dr. David Vera will help match the tracer with the specific goals of the investigator, radiolabel the tracer and assess its stability and then validate the tracer in vivo. Should they desire to assess enzyme activity, they will devise a scheme to assess that effect.
Choice of Radionuclide
The common radionuclides for Single Photon Emission Computed Tomography (SPECT) are 99mTc (half-life = 6hr) and 123I (half-life = 13hr). The positron-emitting radionuclides (with their half-lives) used most frequently are 15O (2.07 min), 13N (10 min) and 18F (109.7 min). The actual specific activity for the most-used PET radionuclides, is on the order of 37-185 TBq/mmol (1000-5000 Ci/mmol) at the end of the cyclotron bombardment. Therefore, this adioactive probe is injected at tracer levels (~nmol injected). Non-traditional PET radionuclides, such as Cu-64, Br-76, Ga-68 and I-124 are available commercially. The general theme is to match the physical and biological half-life, with the required resolution differentiating SPECT from PET.
Choice of the Approach of Using a Radiotracer
To determine the interaction of the drug with a desired binding site, e.g. receptor or enzyme, we will radiolabel the potential drug in such a way as to not disturb the biochemical parameter to be measured and use a radioligand with the desired properties. Usually co-injection is used, but pre-or post-injection may be required depending on the relative pharmacokinetics to validate target binding by competition. Radiotracers can be used for indirect measure of neurotransmitters. For example, neurotransmitter concentration changes can be measured with a reversible receptor radioligand indirectly after administering the potential drug, whose putative mode of action is through neurotransmitter release.
| Tracer | Application |
| [F-18]FEPPA | A TSPO radio ligand used in the imaging of brain inflammation |
| [F-18]FLT | Structural analog of thymdine used as a tracer of cellular proliferation in the primary tumor |
| [F-18]FDOPA | Fluorodopa is used for the imaging of neuroendocrine tumors |
| [F-18]Fallypride | Fallypride is used for the imaging of dopamine D2/D3 receptors. |